New to RAG? If you are relatively new to Retrieval-Augmented Generation and want to build a stronger foundation before diving in, start with this introduction to RAG concepts.
Part 1 of 2 - RAG is easy to ship. Harder to trust!
How silent degradation, invisible hallucination, and unclassified errors led me to instrument every layer of a production RAG pipeline - before the incidents taught me why.
The pattern I kept seeing
A RAG system can look perfectly healthy. It returns answers. It passes tests. Nothing shows up in logs. But that’s only the surface.
Underneath, the system starts to drift. Retrieval quality degrades. Context becomes noisier. The model continues to answer, but with confidence that is no longer grounded. Nothing breaks. Nothing alerts. Trust just fades over time.
I’ve been building a personal AI assistant on Google Cloud Run, integrating with Google Workspace and Microsoft 365. Its RAG pipeline “The Vault” is the most demanding part of the system. Not because it’s hard to build. Because it’s hard to keep honest. Across my own system and conversations with others running RAG in production, the same patterns kept appearing.
Production fails in ways demos never show:
Retrieval quality drifts. Documents get updated. Chunks go stale. The top-k results that worked at launch return off-context noise by week eight. The system still responds - confidently, but wrongly. No 500 error. No alert.
Context-answer misalignment. The LLM receives irrelevant context and generates an answer anyway. Hallucination is invisible unless citation grounding is measured explicitly.
Cost creeps. Long context windows, embedding calls, multiple LLM hops - costs compound quietly. The problem shows up on the cloud bill, not in the logs.
Error patterns go unclassified. A retrieval timeout looks identical in logs to a parsing failure without a taxonomy. “RAG is broken” is not a fixable problem statement. “Structured output parse failures spiked at 14:00” is.
Users do not complain - they leave. Without an explicit feedback mechanism wired to the pipeline, there is no signal that answers are getting worse until the feature goes unused.
LLMs have no inherent knowledge of private data - and no access to information that was not in their training corpus. Web search has largely solved the recency problem for public information. It does nothing for private data - documents that never existed on the public web. RAG is the answer to that gap, and it is nowhere near dead. The hard part is not building it. It is keeping it from quietly getting worse.
These are the reasons I built a full observability layer before shipping the Vault to real users. This two-part post covers every monitoring, alerting, and testing decision I made, and why.
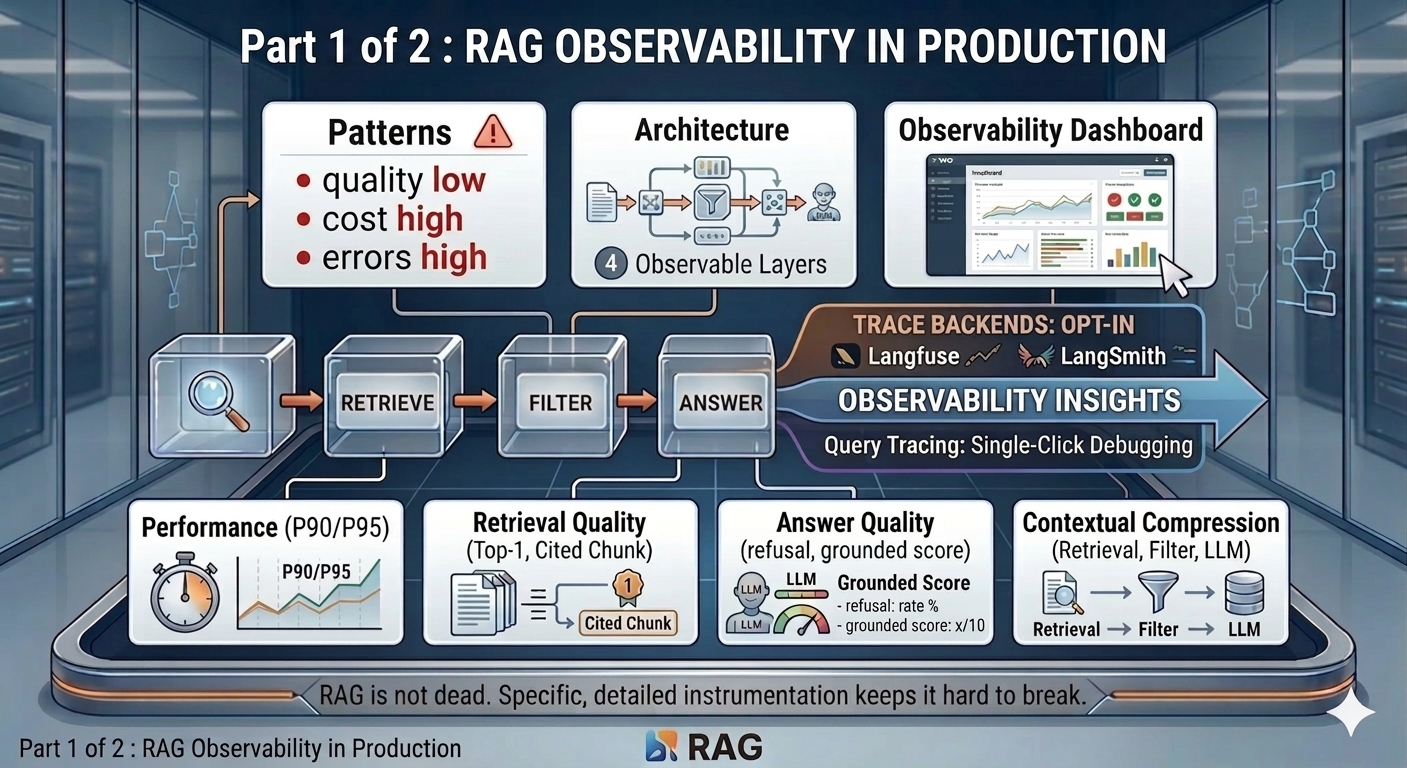
Part 1 covers the architecture, span tracing, and the four pipeline sections of the dashboard: Performance, Retrieval Quality, Answer Quality, and Contextual Compression. Part 2 covers cost, token volume, user feedback, errors, 10-day trend charts, and the CI gates that keep the signals honest.
The architecture - four observability layers
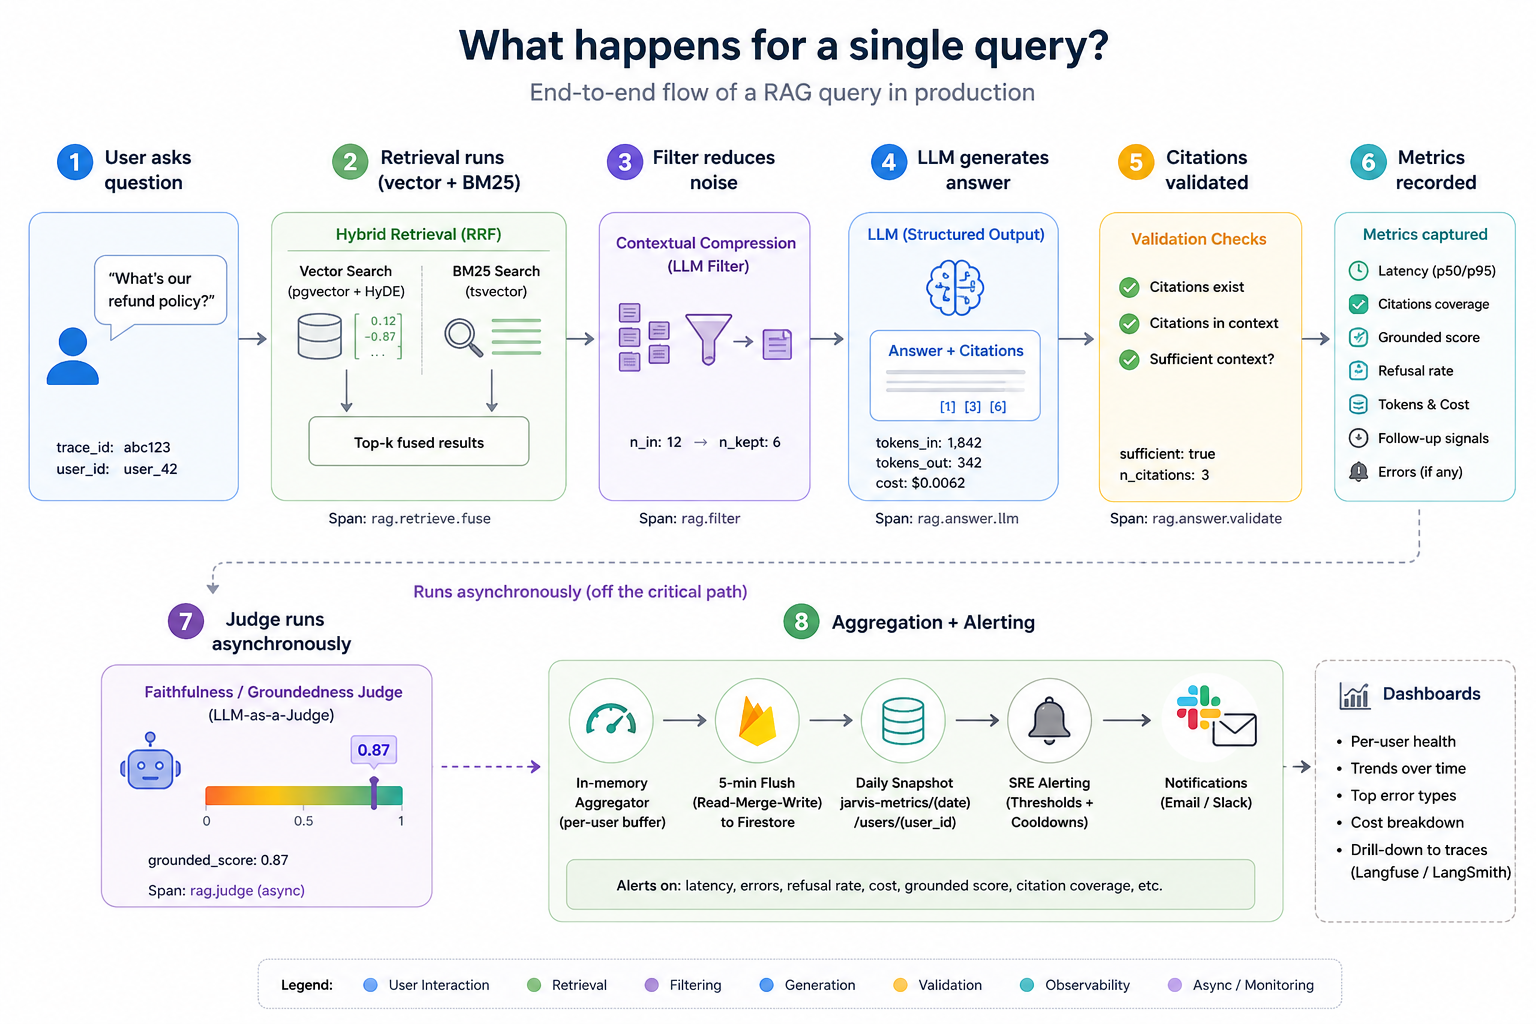
At its core, the pipeline does three things: retrieve → filter → answer. Everything else is instrumentation on top.
          ┌────────────────────────────────────────────────────────────────────┐
          │     User query                                                     │
          │         │                                                          │
          │         ▼                                                          │
          │     rag.retrieve.fuse  ──────── Layer 1: Span emitted              │
          │       ├─ rag.retrieve.vector  (HyDE embedding → pgvector)          │
          │       └─ rag.retrieve.bm25   (tsvector full-text)                  │
          │         │                                                          │
          │         ▼                                                          │
          │     rag.filter  ─────────────── Layer 1: Span emitted              │
          │     (contextual compression)                                       │
          │         │                                                          │
          │         ▼                                                          │
          │     rag.answer.llm  ─────────── Layer 1: Span emitted              │
          │     (structured output + citations)                                │
          │         │                                                          │
          │         ▼                                                          │
          │     Streaming response to user                                     │
          │         │                                                          │
          │         ▼  (background, off critical path)                         │
          │     faithfulness judge  ─────── Layer 1: Score ingested            │
          │                                                                    │
          │     Every span →  Layer 2: Aggregator (per-user, in-memory)        │
          │                →  Layer 3: Langfuse / LangSmith (if opted in)      │
          │                                                                    │
          │     Every 5 min →  Firestore flush  →  Layer 4: SRE alerter        │
          └────────────────────────────────────────────────────────────────────┘
Layer 1 - Span tracing (the frozen contract)
Every operation in the RAG pipeline emits a span. The contract is frozen: trace_id, span_id, name, start_ts, end_ts, duration_ms, input, output, metadata, error. Never renamed. Additive only.
Each span captures not just duration but the substance of what happened:
rag.retrieve.vector:{query, k, n_results, similarity_threshold, mode: "hyde"}rag.retrieve.bm25:{query, k, n_results}rag.retrieve.fuse:{query, k, mode: "hybrid-rrf-hyde"}- parent span for the full retrieval passrag.filter:{n_chunks_in, n_to_filter, n_pinned, n_llm_kept}rag.answer.llm:{n_chunks, sufficient, n_citations, tokens_in, tokens_out, cost_usd}rag.answer.validate:{sufficient, n_citations, answer_chars}- or error type on refusal or invalid citation
On every span exit, the span routes simultaneously to the in-process aggregator and, if the user has opted in, to either Langfuse or LangSmith for trace inspection.
Layer 2 - Per-user metrics aggregation
Spans flow into an in-process aggregator that buffers raw samples per user. Every five minutes it flushes a merged snapshot to Firestore under vault-metrics/{date}/users/{user_id}.
The flush uses a read-then-merge strategy: read whatever was already written today, add the in-memory buffer, write the merged result back. A Cloud Run scale-to-zero restart wipes in-memory state - this design means the day’s earlier data survives. After a confirmed write, in-memory buffers clear so samples are never double-counted on the next flush.
Layer 3 - Deep trace backends (Langfuse / LangSmith)
The aggregator surfaces that something degraded. Langfuse or LangSmith surface which query caused it. Users opt in per-account. The dashboard shows a tracing banner linking directly to the chosen backend - a spike on a metric card has a one-click path to the individual trace.
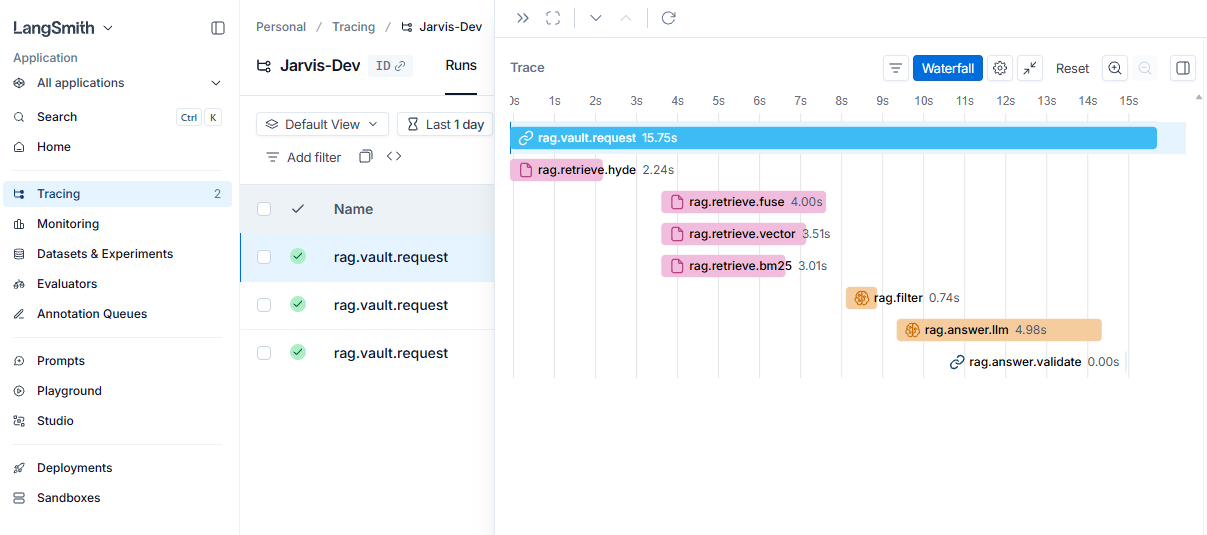
LangSmith Tracing
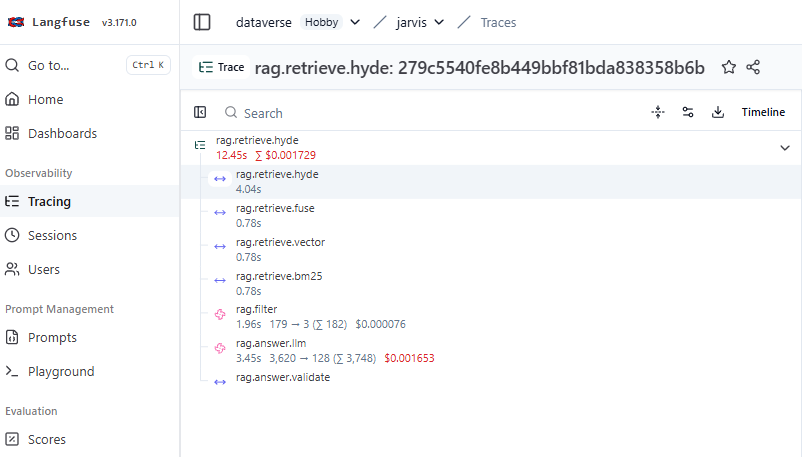
LangFuse Tracing
Layer 4 - SRE alerting with cooldown
After each flush, the alerting module checks four thresholds and fires a Gmail SMTP email on any breach. A per-day cooldown - keyed on the combination of date, user, and breach pattern - prevents alert fatigue. Different breach patterns on the same day each trigger exactly once. The alerter fails silently if credentials are absent - it never crashes the flush loop.
| Threshold | Default | Override env var |
|---|---|---|
| P95 latency | > 10,000 ms | ALERT_P95_LATENCY_MS |
| Refusal rate | > 5% | ALERT_ERROR_RATE |
| Error rate | > 5% | ALERT_ERROR_RATE |
| Daily cost | > $1.00 | ALERT_DAILY_COST_USD |
The observability dashboard
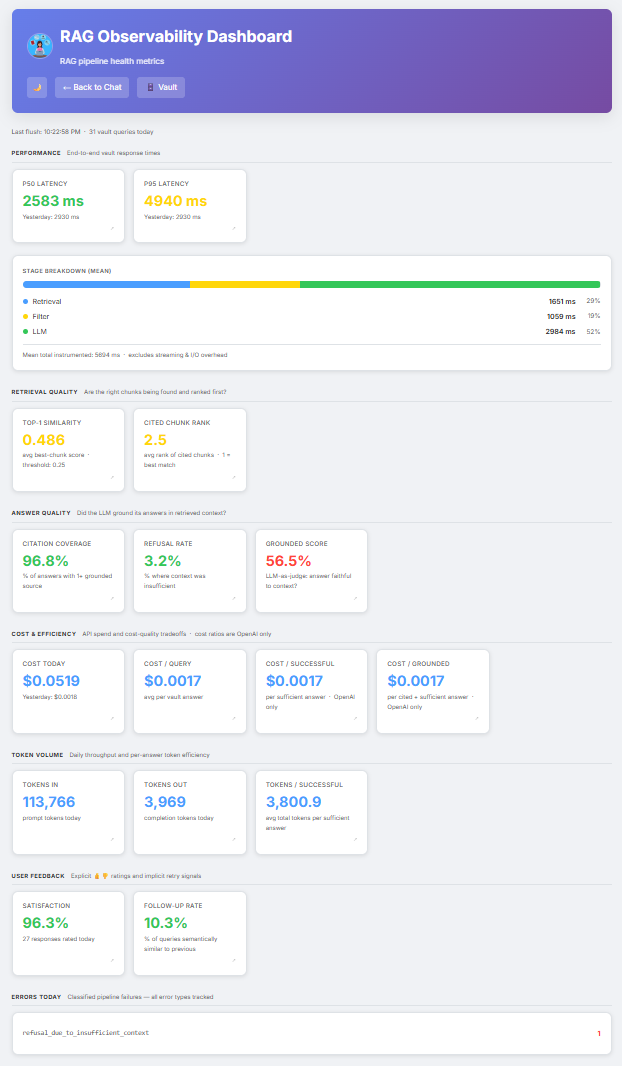
The dashboard lives at /admin/observability. Before any vault queries have run, it shows “Not yet flushed - make a vault query to populate” - a clear signal that data is generated on demand, not pre-populated. Once queries are running, a header strip shows the last flush timestamp and the query count for the day, so the freshness of the numbers is always visible.
Every metric card uses consistent colour semantics - green, yellow, red - making it possible to scan the page in two seconds and know whether anything needs attention. Clicking any card opens a 10-day trend chart in a modal. The dashboard fetches from /api/admin/metrics, which flushes the in-process buffer before reading Firestore, so the view reflects the current minute rather than the last scheduled flush.
Screenshot: RAG Observability Dashboard
The rest of Part 1 walks through the four pipeline sections of the dashboard.
Section 1 - Performance
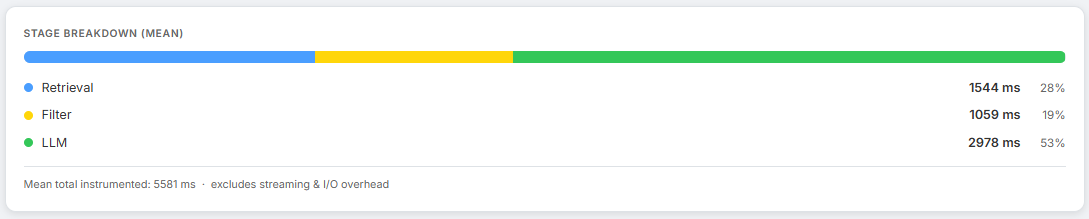
Screenshot: Performance section showing P50, P95, and stage breakdown bar
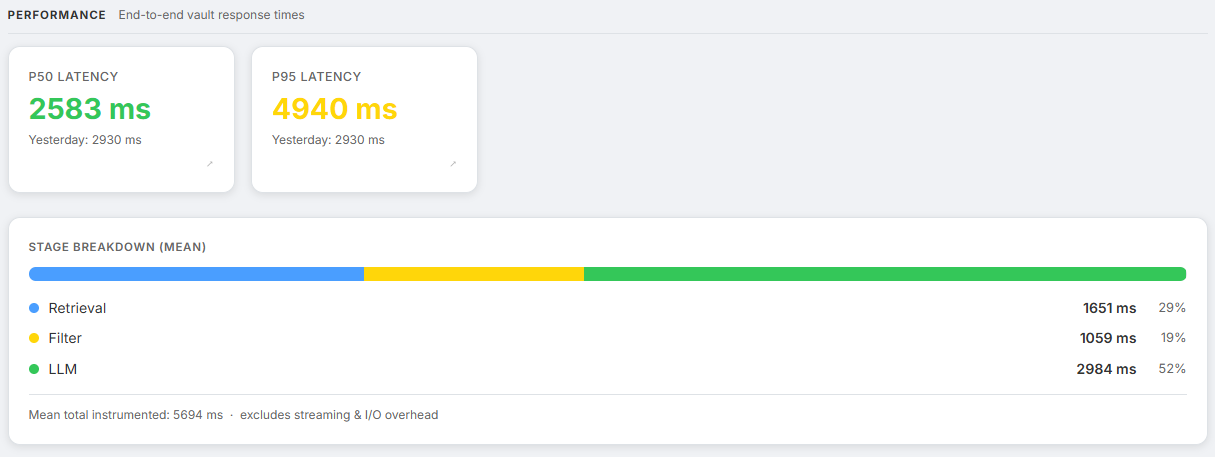
How long are users waiting?
| Metric | What it tells us |
|---|---|
rag.latency.p50_ms | Typical response time - the experience for the median user |
rag.latency.p95_ms | Tail latency - the worst 5% that drive support tickets |
rag.latency.sample_size | Query count today - context for interpreting the above |
rag.latency.breakdown.retrieval_ms | Mean time in the retrieval stage |
rag.latency.breakdown.filter_ms | Mean time in contextual compression |
rag.latency.breakdown.llm_ms | Mean time in LLM answer generation |
Colour thresholds: green below 3 s, yellow below 8 s, red above 8 s.
Below the P50/P95 cards, an inline stage breakdown bar shows retrieval, filter, and LLM time as proportional coloured segments. This is the fastest way to diagnose where latency is being spent. A dominant LLM bar usually means the context window is too large or the model is slow. A dominant retrieval bar usually means the pgvector index needs tuning.
The span tree for a hybrid+HyDE query:
rag.retrieve.fuse          (parent: full retrieval pass)
  ├─ rag.retrieve.vector   (HyDE embedding → cosine similarity on pgvector)
  └─ rag.retrieve.bm25     (raw query → tsvector full-text on PostgreSQL)
rag.filter                  (contextual compression: LLM re-ranks chunks)
rag.answer.llm              (structured output generation with citations)
HyDE generation and BM25 search run concurrently via asyncio.gather. The latency cost of generating a hypothetical passage is amortised - it runs in parallel with BM25, which uses the raw query text.
Section 2 - Retrieval Quality
Screenshot: Retrieval Quality section showing Top-1 Similarity and Cited Chunk Rank cards
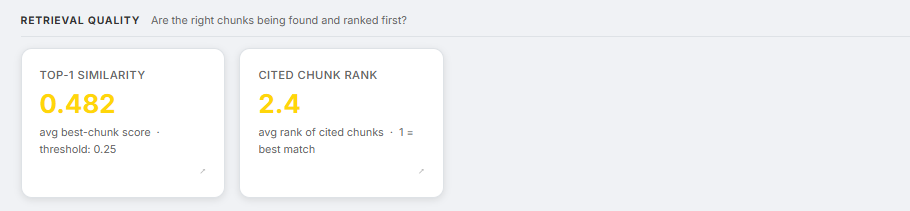
Are the right chunks being found and ranked correctly?
| Metric | What it tells us |
|---|---|
rag.retrieval.top1_similarity | Average cosine similarity of the best-ranked chunk - measures how well the corpus matches query space |
rag.retrieval.cited_rank_avg | Average rank of chunks the LLM actually cited - 1 is ideal; high values mean the best chunk was buried |
Colour thresholds:
- Top-1 similarity: green above 0.65, yellow above 0.40, red below 0.40
- Cited chunk rank: green at rank ≤ 2, yellow at rank ≤ 3.5, red above 3.5
top1_similarity is computed from the raw query embedding - not the HyDE embedding - so it reflects how close retrieval actually got to the question, independent of the hypothetical passage. A declining top1_similarity in the 10-day trend chart is a leading indicator of corpus drift. Documents are aging away from the query distribution before the refusal rate has had time to climb.
cited_rank_avg measures whether the LLM is using the chunks the retriever ranked highest. Consistently citing chunks ranked 3–5 rather than 1–2 means the retrieval ordering is wrong. This is tracked by recording the 1-based citation indices from the structured output and computing the mean.
The retrieval system uses hybrid search: cosine similarity on pgvector combined with BM25 full-text search on PostgreSQL’s native tsvector, fused via Reciprocal Rank Fusion:
RRF score = 1/(60 + vector_rank) + 1/(60 + bm25_rank)
Pure vector search fails on proper nouns, product codes, dates, and any token where semantic similarity is a poor proxy for lexical relevance. BM25 catches those cases. The rag.retrieve.fuse span records candidate pool sizes from both arms before fusion - zero BM25 candidates consistently means something is wrong with the tsvector indexing.
Section 3 - Answer Quality
Screenshot: Answer Quality section showing Citation Coverage, Refusal Rate, and Grounded Score cards
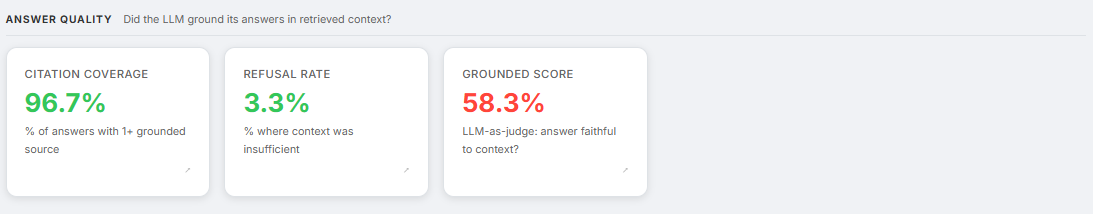
Did the LLM actually use the retrieved context - and did it stay within it? These three metrics measure three different failure modes.
| Metric | What it tells us |
|---|---|
rag.citation.coverage | Fraction of answers with at least one grounded citation |
rag.refusal.rate | Fraction of queries where context was insufficient to answer |
rag.answer.grounded_score | LLM judge score (0.0–1.0): 1.0 = every claim supported, 0.8 = minor inferences, 0.5 = unsupported extrapolations, 0.0 = hallucinated facts |
Colour thresholds:
- Citation coverage: green above 85%, yellow above 65%, red below 65%
- Refusal rate: green below 10%, yellow below 25%, red above 25%
- Grounded score: green above 85%, yellow above 65%, red below 65%
The answer LLM returns a structured object parsed with Pydantic:
class VaultAnswer(BaseModel):
    answer: str           # Text with [n] citation markers
    citations: List[int]  # 1-based indices of chunks actually used
    sufficient: bool      # False triggers a soft refusal
validate_citations() strips any indices that do not exist in the retrieved set. Citation hallucination is a real failure mode - the model fabricates [7] when only chunks 1–4 were retrieved. Each stripped citation logs a citation_validation_fail error and records a span, making it traceable in Langfuse or LangSmith.
A sufficient=False response increments rag.refusal.rate. Citations are suppressed on refusals - showing sources when the context was judged insufficient would be misleading. A rising refusal rate usually means the corpus has drifted: the document that should answer the question is either not indexed or the chunks are stale.
The faithfulness judge. The judge is not a source of truth, it is a scalable proxy for detecting drift. After each vault answer streams to the user, a background task fires an LLM judge call: “Does this answer make only claims directly supported by the retrieved excerpts?” The judge returns a score from 0.0 to 1.0. It runs entirely off the critical path - asyncio.create_task(), never awaited by the streaming response - so it adds zero latency to the user experience. Enable with RAG_ENABLE_FAITHFULNESS_JUDGE=true (on by default; disable to avoid judge costs on very low-volume deployments).
Three metrics, three angles on the same question:
citation.coverage- whether context was citedanswer.grounded_score- how faithfully it was usedrefusal.rate- when the model judged the context too weak to answer at all
Section 4 - Contextual Compression
Screenshot: Stage breakdown bar inside the Performance section with the Filter segment highlighted, and a Langfuse trace showing the rag.filter span details
Vector search retrieves a candidate set. Not all of it is relevant. A naive pipeline sends everything to the answer LLM, burning tokens and injecting noise. The Vault runs a contextual compression step - chunk_filter.py - between retrieval and answer generation.
The algorithm:
- Extract keywords (4+ characters, after stopword removal) from the question.
- Pin any chunk containing a keyword - these always survive, regardless of the LLM verdict.
- Send remaining chunks to the LLM in one batch: “Which of these are relevant to answering this question?”
- Merge pinned + LLM-kept chunks, preserving original order.
Finding - Never fail closed on retrieval
If the filter LLM call fails, the pipeline falls back to passing all chunks to the answer stage. A degraded answer beats no answer. This is not a quality compromise - it is an availability decision. A weaker response is visible and recoverable. A timeout is neither.
The filter span records {n_chunks_in, n_to_filter, n_pinned, n_llm_kept}. Over time this gives a picture of how much noise is entering the pipeline and how much the compressor is catching. Filter latency consuming most of the latency budget is a sign that too many candidate chunks are being retrieved - reduce RAG_MAX_CHUNKS_PER_QUERY.
What Part 1 covers - and what it doesn’t
So far, everything we’ve measured is system-centric. The four sections above instrument the pipeline itself. They cover response speed, whether retrieval found the right chunks, whether the LLM stayed within its evidence, and how aggressively the filter pruned noise before the answer stage.
What they do not cover is what any of this cost, whether users actually found the answers useful, or what broke and why. A pipeline can score well on every metric here and still be quietly failing the people using it - because grounded answers and satisfying answers are not the same thing.
Coming in Part 2: The pipeline metrics are only half the picture. Part 2 covers cost and token efficiency - including the gap between cost-per-query and cost-per-useful-answer that reveals whether the corpus is actually fit for purpose. Then explicit and implicit user feedback. Then the error taxonomy that makes debugging possible instead of just visible. And finally the 10-day trend view and CI gates that turn a snapshot dashboard into a real monitoring system.
NB: All the metrics defined in this blog are taken from my personal AI assistant I have been building on Google Cloud Run, with integrations for Google Workspace, Microsoft 365 and a full RAG pipeline. The observability stack described here is live and handling real queries.